As the 21st century proceeds, countries – particularly developing countries – will face a growing series of short-term shocks (economic crises, climate events, violent attacks, health epidemics, etc) and long-term trends (climate change, migration, economic restructuring, new technologies, etc). In abstract terms, we know the solution: countries must become more resilient.
That is because resilience is defined as the ability of vulnerable systems – countries, regions, communities, value chains, organisations – to withstand, recover from, adapt to, and potentially transform amid change and uncertainty. Resilience will therefore play a crucial role in the achievement of development outcomes. It provides a holistic and long-term approach that is rising up the development agenda.
That is the theory. The challenge arises in practice: there are few credible guides that activists and researchers can follow which explain what resilience is, how to apply resilience metrics, and how to use those metrics to shape action. The University of Manchester has therefore developed RABIT: the Resilience Assessment Benchmarking and Impact Toolkit.
To understand resilience, RABIT identifies nine attributes – or sub-properties – of resilience. Three are primary foundations of resilience: robustness, self-organisation, learning. Six are secondary enablers of resilience: redundancy, rapidity, scale, diversity, flexibility, equality. The stronger these are in a community, the more resilient it will be[1].
Each attribute has a series of key markers: indicators that we can use to assess the strength or weakness of each attribute. These can be measured in two main ways:
- Resilience benchmarking: at the pre-hoc stage of project design, resilience can be benchmarked to establish key areas for resilience-building action during an intervention.
- Resilience impact assessment: RABIT can be used to assess the impact on resilience of interventions during or after their implementation, to draw lessons learned, and to inform future programming/strategising.
Data can be gathered by document review, focus group, interview, or survey. It is then subject to enumeration that enables a variety of different visualisations, as illustrated in Figure 1. These identify current resilience strengths to build on, and current resilience lacunae that need to be addressed.
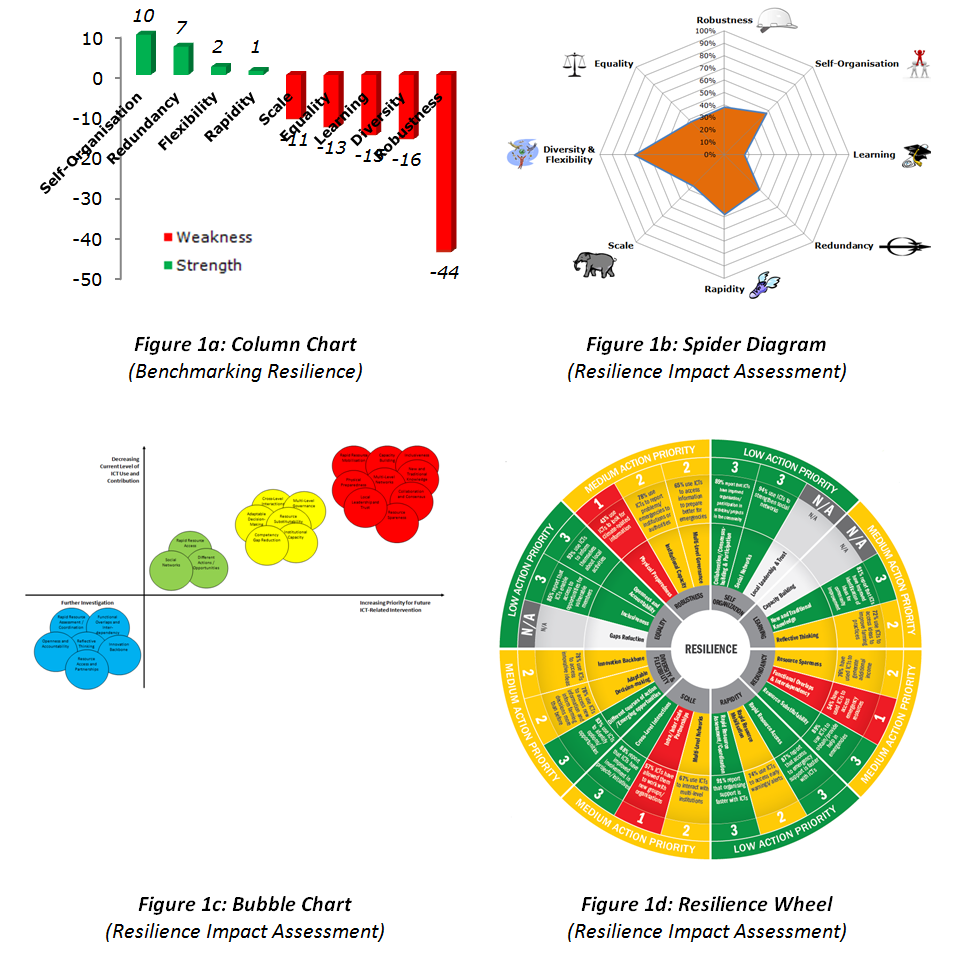
Based on the visualisations illustrated in Figure 1 plus further analysis, RABIT then provides the basis for prioritising future interventions which will build resilience. A sample is shown in Table 1, with interventions identified; typically following a discussion of the visualisations with key stakeholders. An indication is provided of which stakeholders – in this case, community-level (C), municipality-level (M) and national-level (N) – will be involved.
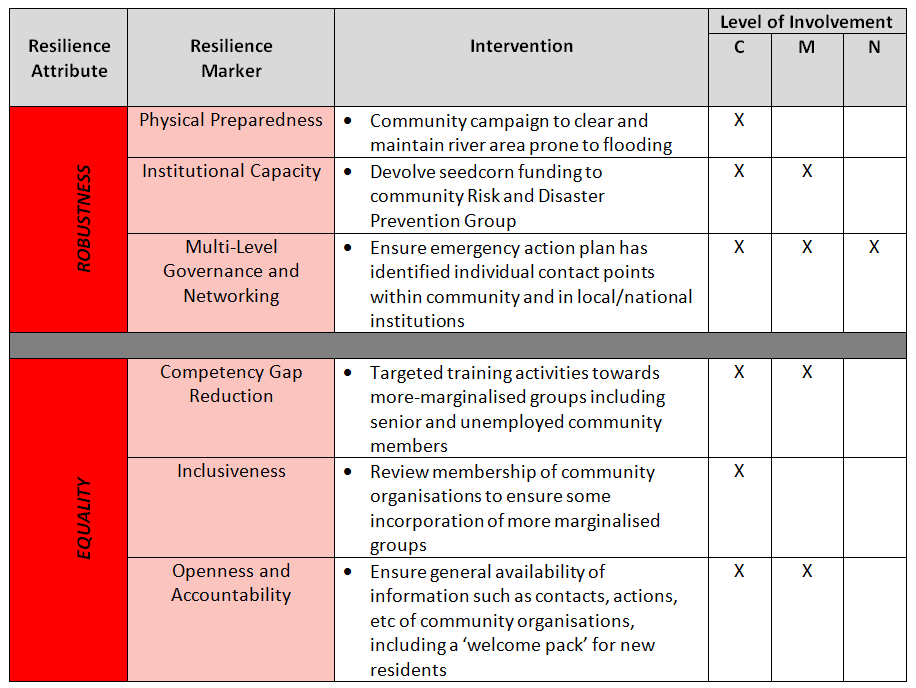
Table 1. Sample priority actions to improve resilience
For full details of the Implementation Handbook showing how to use the RABIT toolkit plus case studies of RABIT’s application, see: https://www.niccd.org/resilience.
We are happy to answer questions about application of the framework, and to provide support to those seeking to implement RABIT: niccd.project@gmail.com.
[1] Our illustration will be at the level of individual communities but RABIT is applicable to all and any of the systems described from households to nations.